



A buyer’s guide to the tests behind a carbon credit, and why buildings need a different one.
Additionality is the most important word in carbon markets that almost nobody outside carbon markets uses.
Carbon credit additionality means a credit only counts if the emissions reduction behind it wouldn’t have happened without carbon finance. If the project was going ahead anyway, the buyer didn’t fund change. They funded a coincidence.
The tricky part is that additionality is a question about a world that never happened. You can’t observe the version of the building where nobody paid for the heat pump. (Parallel universes don’t share their utility bills.) So every additionality test is a stand-in for that counterfactual, and the question is which stand-in fits what you’re crediting. For buildings, I don’t think most of the usual ones do. I’ll start with how we test additionality, then explain why we don’t lean on the alternatives.
Under version 1.2 of our Building Emissions Reduction Standard (BERS), every project goes through two checks.[1]
Then every project that passes gets the same stress test. We rerun the numbers with more conservative assumptions, like lower capital costs, higher energy savings and a lower discount rate, each of which makes the retrofit look more viable without carbon finance. The result counts as robust when the NPV stays negative in at least two of the three scenarios.
Finally, each passing project gets an Investment Analysis Rating from 1 to 5, based on how long the retrofit would take to pay for itself without carbon finance. The scale comes straight from BERS:[1]
We run the assessment ourselves rather than leaving it to the party who benefits from passing, and we hire the independent validators and verifiers directly.[1] The financial data has to match the engineering design signed by a licensed Professional Engineer. An accredited Validation Body independently checks the financial inputs to our calculations, and we can have them audited again at verification. If something’s misstated, we can revise the rating or suspend issuance. The assessment is locked in at the Preliminary Assessment and holds for the full ten-year crediting period. The pass/fail result and rating are published on the Ontoly Registry for every project, while the owner’s commercially sensitive numbers stay confidential.
On timing, we can credit retrofits completed within the 24 months before an owner applies, an approach designed to meet the ICVCM’s “prior consideration” requirements.[1]
Let’s run the numbers on a made-up building. Round numbers, no tricks.
A 48-unit apartment building in Alberta has a 15-year-old gas boiler. It works fine and could probably run for another decade. The owner is weighing an early switch to an air-source heat pump system.
Against $600,000 of net capital cost, the NPV is roughly −$496,000. The project passes. It never pays for itself within the equipment’s life, so it earns a 5. And it holds up under stress-testing: even if capital costs came in 15% lower, the NPV would still be about −$373,000.
Carbon finance should go where it changes the decision. A good test can tell the difference, and rank projects by how much they need the money.
Some carbon crediting programs assess additionality for a whole portfolio at once, rolling hundreds or thousands of buildings into one project and checking the average. It’s efficient. It’s also a great place to hide 300 buildings.
Picture a portfolio of 1,000 buildings:
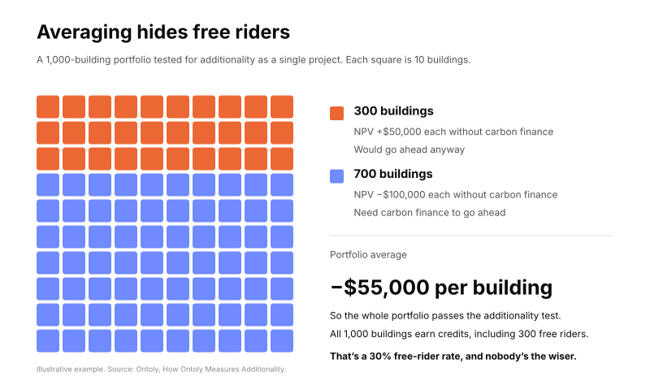
Average them and the portfolio’s NPV is −$55 million, so the whole thing passes. All 1,000 buildings earn credits, including the 300 that didn’t need a cent. That’s a 30% free-rider rate, baked in from day one, and nobody’s the wiser.
It cuts the other way, too. Change the mix to 600 buildings at +$80,000 and 400 at −$100,000, and the portfolio’s NPV is +$8 million. The whole thing fails, and the 400 buildings that really needed help get nothing.
The average building doesn’t exist. Nobody has ever retrofitted it. Statisticians have a name for this mistake: the ecological fallacy, assuming that what’s true of a group is true of each member. Aggregation can even reverse a relationship that holds for individuals.[2] And real retrofit costs vary enormously from building to building. A Lawrence Berkeley National Laboratory analysis of 1,739 home retrofit projects found very large cost ranges for almost every measure, with costs highest in older homes and colder climates.[3]
That’s why BERS defines a project as a single building. Aggregation is only allowed where individual meters don’t exist, and then only for two to five buildings on the same property with shared utility accounts.[1] Every building gets its own NPV test, its own rating and its own measured results.
Carbon crediting programs have used a familiar toolkit for about twenty years. A 2025 review in the journal Carbon Management identified nine types of additionality test.[4] We use two of them, regulatory surplus and timing, alongside our financial test. The others have a mixed track record. A 2016 study for the European Commission found that 85% of projects in the UN’s Clean Development Mechanism had a low likelihood of delivering reductions that were additional and not overestimated.[5] Economists later estimated that at least 52% of approved offsets from wind farms in India went to projects that would very likely have been built anyway.[6] So yes, the market has been fooled before. For buildings, the remaining tests make it far too easy to happen again.
A common practice test assumes that once a technology is widespread, new projects using it would have happened anyway. Under the Clean Development Mechanism, the line is 20%: once more than a fifth of similar projects use a technology, it’s common practice.[7] For buildings, that logic breaks in three ways.
Common practice is often used as a proxy for missing project-level data, with thresholds arbitrary enough that categories can be redrawn so a project qualifies.[4] Even the authors of the European Commission study noted that market penetration isn’t a good proxy for every project type.[5] Buildings don’t need a proxy. Every building has measured utility data, a capital budget and an engineer’s report. That’s why BERS v1.2 doesn’t include a common practice test.[1]
These tests run into similar problems in buildings:
Look, we won’t overstate what our test does. Proving that carbon finance caused a retrofit is close to impossible. You can’t run the same building twice, once with the money and once without, and every owner’s decision involves some psychology. Statisticians call this the fundamental problem of causal inference.[20] Every additionality test is an estimate.
We think the cold, hard math of a building’s own finances is the most objective place to start, and the best way to build real trust in additionality. Legal scholars have identified imperfect information and conflicts of interest as two of the voluntary carbon market’s core failures.[21] Building-level numbers narrow that information gap. And as the market learns more about what buyers are willing to pay and what building owners need before they’ll go ahead, credits can be priced better over time.
So we think in probabilities. The engineering firms designing these retrofits tell us that some building owners won’t move ahead even when a project pays back in three or four years. It comes down to each owner’s appetite for the investment. What we really want to know is the probability that an owner goes ahead with a retrofit because carbon finance covers part of the capital cost. How much do the odds rise when carbon finance closes some of the gap?
What we do know is that upfront cost weighs heavily. In the UK government study I mentioned earlier, which looked at how households choose a heating system, upfront cost mattered roughly 7 to 16 times more than running costs. On average, every £1,000 cut in upfront cost raised the share choosing a heat pump by about 10 percentage points. In one group of households, 65% chose a heat pump when it cost about the same as a new gas boiler, but only 7% did at £10,000.[14]
So the size of the capital gap is one of the strongest signals of whether a retrofit happens without help. That’s exactly what our test measures, one building at a time:
The short version, for skimmers. Behind every Ontoly credit:
Carbon buyers have been burned before, and most of you aren’t that easy to fool anymore. Good. Neither are we. Many common additionality tests rely on judgment calls.[19] Ours asks a simple question: without carbon finance, does this retrofit pay for itself, and if not, how far off is it? Then we score each project from 1 to 5. When you look at a project on the Ontoly Registry, you’ll see whether it passed and how it rated, so you can choose how much additionality you’re paying for.
If you want your money to make the biggest difference, filter for projects rated 5. Those are the retrofits that would never pay for themselves on their own, the ones least likely to happen without you. It’s also why we expect 5-rated credits to command a premium: they’re doing the most work. And because every rating is public, you can see the spread across the registry for yourself.
Every additionality test is a bet on a world we’ll never see. We’d rather place that bet with a building’s real numbers than a sector average. Carbon markets have had enough guesswork. We’d like to bring the receipts.
If that’s the kind of proof you want behind your credits, Open a free buyer portal account and look through the projects. Curious how we go there? Read why I started Ontoly. Wondering what all this rigour costs? Read what a building retrofit tonne actually costs.
Every project under BERS v1.2 must pass two checks: regulatory surplus, meaning the reduction can’t be legally required, and a net present value (NPV) test. If the retrofit’s NPV is below zero without carbon revenue, after grants, rebates, energy savings and any avoided building performance fines, it passes. Passing projects are stress-tested and rated from 1 to 5.
The Investment Analysis Rating shows how long a retrofit would take to pay for itself without carbon finance. A 5 means more than 10 years or never, signalling profound financial barriers. A 1 means 1 to 3 years. Every project’s rating is published on the Ontoly Registry.
Common practice tests treat a technology as non-additional once it’s widespread, often above 20% adoption. The International Energy Agency’s net zero pathway needs heat pumps to meet 55% of space heating demand by 2050, and the last buildings to switch are likely to be the hardest and most expensive. A building-level financial test works at any level of adoption.
Averaging a portfolio can hide free riders or reject buildings that genuinely need help. Under BERS, a project is a single building, and aggregation is limited to two to five buildings on one property with shared meters. Each building gets its own NPV test, rating and measured results.
Not completely. You can never observe the same building both with and without carbon finance, which statisticians call the fundamental problem of causal inference. The best a test can do is estimate that counterfactual well. Ontoly’s test focuses on the capital gap, one of the strongest drivers of whether a retrofit goes ahead.
Ashley Sarauer
Founder & CEO, Ontoly | Squamish, BC
About the author. Ashley Sarauer is the founder and CEO of Ontoly, a carbon credit registry for building decarbonization. An environmental economist by training, she worked on Alberta’s Technology Innovation and Emissions Reduction (TIER) Regulation, led British Columbia’s Provincial Emissions Inventory for a time, and served as an integrity lead at a leading voluntary carbon market registry.
[1] Ontoly (2026). Building Emissions Reduction Standard (BERS), Version 1.2, Section 10 (Additionality) and Section 4.4 (Retroactive crediting). https://www.ontoly.org/bers-program
[2] Freedman, D. A. (2002). The Ecological Fallacy. Department of Statistics, University of California, Berkeley (discussing Robinson, W. S. (1950), Ecological correlations and the behavior of individuals, American Sociological Review 15: 351–357). https://www.stat.berkeley.edu/~census/ecofall.txt
[3] Walker, I., Less, B., Casquero-Modrego, N. and Rainer, L. (2022). The Costs of Home Decarbonization in the US. Lawrence Berkeley National Laboratory, ACEEE Summer Study on Energy Efficiency in Buildings. https://www.aceee.org/wp-content/uploads/2026/10/the-costs-of-home-decarbonization.pdf
[4] Schaefer, M., Gebara, C. H., Bjørn, A. and Brander, M. (2025). Identifying options for additionality tests in the context of scope 2 market-based accounting. Carbon Management 16(1). https://www.tandfonline.com/doi/full/10.1080/17583004.2025.2473910
[5] Cames, M. et al. (2016). How additional is the Clean Development Mechanism? Öko-Institut, for the European Commission (DG CLIMA). https://www.atmosfair.de/wp-content/uploads/clean_dev_mechanism_en.pdf
[6] Calel, R., Colmer, J., Dechezleprêtre, A. and Glachant, M. (2025). Do Carbon Offsets Offset Carbon? American Economic Journal: Applied Economics 17(1):1–40. https://researchonline.lse.ac.uk/id/eprint/127329
[7] UNFCCC Clean Development Mechanism. Methodological Tool 24: Common practice (paragraph 18). https://cdm.unfccc.int/methodologies/PAmethodologies/tools/am-tool-24-v1.pdf
[8] International Energy Agency (2023). Global heat pump sales continue double-digit growth. https://www.iea.org/commentaries/global-heat-pump-sales-continue-double-digit-growth
[9] International Energy Agency (2023). Net Zero Roadmap, 2023 update: Space heating. https://www.iea.org/reports/space-heating
[10] International Energy Agency (2022). Is the energy crisis really making the business case for heat pumps? https://www.iea.org/reports/is-the-energy-crisis-really-making-the-business-case-for-heat-pumps
[11] American Council for an Energy-Efficient Economy (2025). Report: Electrification costs less than alternative fuels in hardest-to-decarbonize buildings (press release, 30 April 2025). https://www.aceee.org/press-release/2025/04/report-electrification-costs-less-alternative-fuels-hardest-decarbonize
[12] Casquero-Modrego, N., Venkatraman, M., Gul, S., Less, B. and Walker, I. S. (2026). Understanding the Costs and Barriers of Residential Electrical Panel and Service Upgrades. Lawrence Berkeley National Laboratory, ACEEE Summer Study. https://eta-publications.lbl.gov/bibcite/reference/37112
[13] Canary Media (2023). Americans like home electrification, but also still love their gas stoves. Reporting the Yale and George Mason University Climate Change in the American Mind survey. https://canarymedia.com/articles/electrification/americans-like-home-electrification-but-also-still-love-their-gas-stoves
[14] UK Department for Energy Security and Net Zero (2024). Impact of heat pump costs on uptake: a discrete choice experiment. Prepared by ICF Consulting Services, The Behaviouralist and Moonlight Research. https://www.gov.uk/government/publications/impact-of-heat-pump-costs-on-uptake-a-discrete-choice-experiment--2
[15] Bento, A., Kanbur, R. and Leard, B. (2016). On the importance of baseline setting in carbon offsets markets. Climatic Change 137(3): 625–637. https://ideas.repec.org/a/spr/climat/v137y2016i3d10.1007_s10584-016-1685-2.html
[16] Millard-Ball, A. (2013). The trouble with voluntary emissions trading: Uncertainty and adverse selection in sectoral crediting programs. Journal of Environmental Economics and Management 65(1): 40–55. https://ideas.repec.org/a/eee/jeeman/v65y2013i1p40-55.html
[17] S&P Global Commodity Insights (2024). Renewable energy projects fail to meet high-integrity label: ICVCM (6 August 2024). https://www.spglobal.com/commodity-insights/en/news-research/latest-news/natural-gas/080624-renewable-energy-projects-fail-to-meet-high-integrity-label-icvcm
[18] Integrity Council for the Voluntary Carbon Market (2024). Board observations on renewable energy methodologies. https://icvcm.org/wp-content/uploads/2024/08/ICVCM_Board-Observations-for-RE.pdf
[19] Schneider, L. (2009). Assessing the additionality of CDM projects: practical experiences and lessons learned. Climate Policy 9(3): 242–254. https://ideas.repec.org/a/taf/tcpoxx/v9y2009i3p242-254.html
[20] Holland, P. W. (1986). Statistics and Causal Inference. Journal of the American Statistical Association 81(396): 945–960. https://www.cs.columbia.edu/~blei/fogm/2020F/readings/Holland1986.pdf
[21] Battocletti, V., Enriques, L. and Romano, A. (2024). The Voluntary Carbon Market: Market Failures and Policy Implications. University of Colorado Law Review 95(3): 519–573. Working paper: ECGI Law Series 688/2023. https://www.ecgi.global/publications/working-papers/the-voluntary-carbon-market-market-failures-and-policy-implications
[22] Boomhower, J. and Davis, L. W. (2014). A credible approach for measuring inframarginal participation in energy efficiency programs. Journal of Public Economics 113: 67–79. https://ideas.repec.org/a/eee/pubeco/v113y2014icp67-79.html
[23] Houde, S. and Aldy, J. E. (2017). Consumers’ Response to State Energy Efficient Appliance Rebate Programs. American Economic Journal: Economic Policy 9(4):227–255. https://ideas.repec.org/a/aea/aejpol/v9y2017i4p227-55.html
[24] Fowlie, M., Greenstone, M. and Wolfram, C. (2018). Do Energy Efficiency Investments Deliver? Evidence from the Weatherization Assistance Program. Quarterly Journal of Economics 133(3). Working paper: NBER w21331. https://www.nber.org/papers/w21331